Disclaimer: This section is primarily for researchers, academics and journalists. For a more accessible write-up of the data, see the About page, and specifically the data overview section
The methodology of the campaign is to use 2010 as a baseline for education funding and to examine whether schools – individually and by locality – have suffered cuts in comparison to that baseline. The use of school spending power as a definition of real-terms funding allows the campaign to factor in the additional costs that schools have faced, providing a more complete picture of the pressure on school funding. For example the measure gives a more accurate reflection of the costs schools actually face for staff pay and energy costs, which have increased drastically over the last few years.
When looking at funding, we also choose to focus on the mainstream schools block rather than the core schools budget, as this includes the high needs budget. While this provides additional funds to schools overall, for any particular school it incurs additional costs. Therefore, while some claim that school funding has returned to 2010 levels in real-terms when set against inflation over that period, schools remain some way behind 2010 levels taking into account their actual costs. For 2023/24 schools were still £3.2bn short of the 2010 levels for the mainstream schools block alone. This means that the pressure on school budgets remains extremely challenging with continuing cutbacks inevitable in many settings.
In brief: how we calculate school costs and funding
We first estimate school costs by decomposing total cost into staff costs and non-staff costs, accounting for the ways policy changes, inflation, and other price shocks have impacted these. We then estimate school funding by combining the funds from different streams including pupil premium grant funding, schools block funding, etc. This allows for an accurate picture of the cuts to school funding since the 2010-11 academic year, however the impact on individual schools may slightly vary based on staffing, resources required and other unique sources of additional costs.
School Costs
Staff Costs
Teachers
We have taken average increases in teachers’ pay for 2009-10 onwards and included a factor for pay drift from 2021-22 onwards using DfE figures[1]. Teachers pay increases at the start of each academic year; we have calculated the rate for each financial year by finding five twelves of the preceding year’s increase and seven twelfths of the current year’s increase.
We have included the impact of changes to employers’ National Insurance (NI) contributions. In April 2011, the rate was increased from 12.8 per cent to 13.8 per cent[2], we calculate this added 0.4 per cent to pay costs. In April 2012, the rebate for Contracted-Out Salary Related pensions (COSRs) was reduced from 3.7 per cent to 3.4 per cent. We estimate this added 0.1 per cent to costs. In 2016, the COSRs rebate was abolished we estimate this added 2.6 per cent to teacher costs.
We have included changes to employer contributions to the Teachers’ Pension Scheme. In September 2015, employers’ contributions were increased from 14.1 per cent to 16.4 per cent. When these changes were converted to the financial year, they added 1.3 per cent to costs in 2015-16 and 1 per cent in 2016-17. In September 2019, the rate was increased to 23.6 per cent. This added 4.2 per cent to teacher costs in 2019-20 and 3 per cent in 2020-21. In April 2024, the rate was increased to 28.6%.
We have included the introduction of Health and Social Care Levy in April 2022 and its abolition in November 2022. This added 0.4 per cent[3] to the pay bill in 2022-23 and reduced it by the same amount in 2023-24.
| Year | Pay award (AY) | Pay Drift (AY) | Pay (AY) | Pay (FY) | National Insurance (FY) | Pensions (FY) | Health and Social Care Levy (FY) | Annual change (FY) |
|---|---|---|---|---|---|---|---|---|
| 2009-10 | 2.3% | 0.0% | 2.3% | |||||
| 2010-11 | 2.3% | 0.0% | 2.3% | 2.3% | 0.0% | 0.0% | 2.3% | |
| 2011-12 | 0.0% | 0.0% | 0.0% | 1.0% | 0.4% | 0.0% | 1.4% | |
| 2012-13 | 0.0% | 0.0% | 0.0% | 0.0% | 0.1% | 0.0% | 0.1% | |
| 2013-14 | 1.0% | 0.0% | 1.0% | 0.6% | 0.0% | 0.0% | 0.5% | |
| 2014-15 | 1.0% | 0.0% | 1.0% | 1.0% | -0.1% | 0.0% | 0.9% | |
| 2015-16 | 1.0% | 0.0% | 1.0% | 1.0% | 0.0% | 1.3% | 2.3% | |
| 2016-17 | 1.0% | 0.0% | 1.0% | 1.0% | 2.6% | 1.0% | 4.6% | |
| 2017-18 | 1.2% | 0.0% | 1.2% | 1.1% | 0.0% | 0.0% | 1.1% | |
| 2018-19 | 2.7% | 0.0% | 2.7% | 2.1% | 0.0% | 0.0% | 2.0% | |
| 2019-20 | 2.9% | 0.0% | 2.9% | 2.8% | 0.0% | 4.2% | 7.0% | |
| 2020-21 | 3.1% | 0.0% | 3.1% | 3.0% | 0.0% | 3.0% | 6.1% | |
| 2021-22 | 0.0% | 0.2% | 0.2% | 1.4% | 0.0% | 0.0% | 1.4% | |
| 2022-23 | 5.4% | -0.2% | 5.2% | 3.1% | 0.0% | 0.0% | 0.4% | 3.5% |
| 2023-24 | 6.5% | 0.4% | 6.9% | 6.2% | 0.2% | 0.0% | -0.4% | 5.9% |
| 2024-25 | 5.5% | 0.3% | 5.8% | 6.3% | 0.2% | 5.0% | 11.4% |
Non-teaching staff
We have used the National Joint Council (NJC) pay awards, which cover all local authority staff. In recent years, there have been uplifts in the minimum wage that outstrip pay awards for other council workers. We made an index for school support staff pay by sending Freedom of Information requests (FOIs) to a representative sample of local authorities and then tracked the value of the pay points back to April 2015 and weighted them by the number of staff paid on each grade from the FOIs. Our results differ with the DfE analysis for the period 2018 to 2020, where they have estimated the increase in pay as 6.3 per cent over the two years; however, our analysis shows it was 7.5 per cent. The reason is that the DfE analysis only made an adjustment to pay the National Living Wage (NLW) to those grades beneath it; however, grades above the NLW also received higher awards to maintain differentials. Our estimate for the pay award for April 2022 is 8.5 per cent which is the same as the DfE’s.
We have included the impact of National Insurance changes and used the same figures as for teachers above.
We have also included the impact of changes in employer contributions to the Local Government Pension Scheme. Wherever possible we have taken these from DfE estimates.
We have also accounted for the introduction and abolition of the Health and Social Care Levy as for teachers.
| Year | Pay award (FY) | National Insurance (FY) | Pensions | Health and Social Care Levy (FY) | Total |
|---|---|---|---|---|---|
| 2010-11 | 0.0% | 0.0% | 0.0% | 0.0% | |
| 2011-12 | 0.0% | 0.4% | 0.0% | 0.4% | |
| 2012-13 | 0.0% | 0.1% | 0.0% | 0.1% | |
| 2013-14 | 1.0% | 0.0% | 0.0% | 1.0% | |
| 2014-15 | 3.1% | -0.1% | 0.0% | 3.0% | |
| 2015-16 | 0.0% | 0.0% | 0.0% | 0.0% | |
| 2016-17 | 1.4% | 2.6% | 0.0% | 4.0% | |
| 2017-18 | 1.3% | 0.0% | 1.1% | 2.4% | |
| 2018-19 | 3.7% | 0.0% | -0.4% | 3.3% | |
| 2019-20 | 3.7% | 0.0% | 0.2% | 3.9% | |
| 2020-21 | 2.8% | 0.0% | -0.5% | 2.3% | |
| 2021-22 | 1.8% | 0.0% | -0.3% | 0.4% | 1.9% |
| 2022-23 | 8.5% | 0.0% | 0.0% | 0.4% | 8.1% |
| 2023-24 | 7.6% | 0.2% | -1.1% | 6.5% | |
| 2024-25 | 4.6% | 0.2% | -0.1% | 4.7% |
Non-Staff Costs
We have used the Consumer Prices’ Index (CPI) to estimate non-staff costs. Previously we used the GDP Deflator[4] but then had to separately account for energy costs, so we have used CPI for its simplicity. The figures are taken from the Office for Budgetary Responsibility.
| Year | CPI |
|---|---|
| 2010-11 | 3.5% |
| 2011-12 | 4.3% |
| 2012-13 | 2.7% |
| 2013-14 | 2.3% |
| 2014-15 | 1.1% |
| 2015-16 | 0.1% |
| 2016-17 | 1.1% |
| 2017-18 | 2.8% |
| 2018-19 | 2.3% |
| 2019-20 | 1.7% |
| 2020-21 | 0.6% |
| 2021-22 | 4.0% |
| 2022-23 | 10.0% |
| 2023-24 | 5.7% |
| 2024-25 | 2.3% |
Costs Summary
School expenditure has three main components; teachers’ pay, non-teaching staff pay and non-staff costs[7]. We used the DfE figures as they have changed over time. We have weighted the inflation due to teachers’ pay, non-teaching staff pay and non-staff costs by their share of expenditure. For the years 2017-18 and earlier, we used the shares: teachers’ pay (52%), non-teaching staff pay (28%) and non-staff costs (20%). For 2018-19 to 2019-20, we used the shares: teachers’ pay (52%), non-teaching staff pay (29%) and non-staff costs (19%). For 2020-21, we used the shares: teachers’ pay (53%), non-teaching staff pay (28%) and non-staff costs (19%). And for 2022-23 to 2024-25, we used the shares: teachers’ pay (54%), non-teaching staff pay (28%) and non-staff costs (18%).
| Year | Unweighted | Share of expenditure | Costs weighted by expenditure | Schools’ costs per pupil | ||||||
| Teachers’ pay | Non-teaching staff pay | Non-staff costs | Teachers’ pay | Non-teaching staff pay | Non-staff costs | Teachers’ pay | Non-teaching staff pay | Non-staff costs | ||
| 2010-11 | 2.3% | 0.0% | 3.5% | 52.0% | 28.0% | 20.0% | 1.2% | 0.0% | 0.7% | 1.9% |
| 2011-12 | 1.4% | 0.4% | 4.3% | 52.0% | 28.0% | 20.0% | 0.7% | 0.1% | 0.9% | 1.7% |
| 2012-13 | 0.1% | 0.1% | 2.7% | 52.0% | 28.0% | 20.0% | 0.0% | 0.0% | 0.5% | 0.6% |
| 2013-14 | 0.5% | 1.0% | 2.3% | 52.0% | 28.0% | 20.0% | 0.3% | 0.3% | 0.5% | 1.0% |
| 2014-15 | 0.9% | 3.0% | 1.1% | 52.0% | 28.0% | 20.0% | 0.5% | 0.9% | 0.2% | 1.5% |
| 2015-16 | 2.3% | 0.0% | 0.1% | 52.0% | 28.0% | 20.0% | 1.2% | 0.0% | 0.0% | 1.2% |
| 2016-17 | 4.6% | 4.0% | 1.1% | 52.0% | 28.0% | 20.0% | 2.4% | 1.1% | 0.2% | 3.7% |
| 2017-18 | 1.1% | 2.4% | 2.8% | 52.0% | 28.0% | 20.0% | 0.6% | 0.7% | 0.6% | 1.8% |
| 2018-19 | 2.0% | 3.3% | 2.3% | 52.0% | 29.0% | 19.0% | 1.1% | 1.0% | 0.4% | 2.4% |
| 2019-20 | 7.0% | 3.9% | 1.7% | 52.0% | 29.0% | 19.0% | 3.6% | 1.1% | 0.3% | 5.1% |
| 2020-21 | 6.1% | 2.3% | 0.6% | 53.0% | 28.0% | 19.0% | 3.2% | 0.6% | 0.1% | 4.0% |
| 2021-22 | 1.4% | 1.9% | 4.0% | 54.0% | 28.0% | 18.0% | 0.8% | 0.5% | 0.7% | 2.0% |
| 2022-23 | 3.5% | 8.1% | 11.7% | 54.0% | 28.0% | 18.0% | 1.9% | 2.3% | 2.1% | 6.2% |
| 2023-24 | 5.9% | 6.5% | 5.6% | 52.0% | 30.0% | 18.0% | 3.1% | 2.0% | 1.0% | 6.0% |
| 2024-25 | 11.4% | 4.7% | 2.3% | 52.0% | 30.0% | 20.0% | 5.9% | 1.4% | 0.4% | 7.8% |
School Funding for Primary and Secondary Schools
Core Funding for Primary and Secondary
We looked at the core funding streams for mainstream schools listed below:
- · Schools Block funding;
- · Pupil Premium grant;
- · Education Services Grant for 2010-11 to 2016-17;
- · Teachers’ Pay Grant for 2018-19, 2019-20 and 2020-21;
- · Teachers’ Employer Pension Contributions Grant for 2019-20, 2020-21 and 2024-25;
- · Schools’ Supplementary Grant for 2022-23;
- · Mainstream Schools’ Additional Grant for 2023-24;
- · Teachers’ Pay Additional Grant 2023-24 and 2024-25;
- · Core Schools’ Budget Grant 2024-25.
School Funding
We have taken annual schools level Government data releases from 2011-12 to 2024-25 as the basis for our calculations[8].
The DfE provided a notional figure for the Schools Block in 2012-13 to demonstrate that the per pupil rate had not changed between 2012-13 and 2013-14 at either national or local authority level[9]. Consequently, we have used this figure for 2012-13. For school level allocations for 2012-13, we used the per pupil figure from 2013-14.
We estimated the size of the Schools Block in 2010-11 and 2011-12. We took the figure for total school funding for Reception to Year 11 pupils reported in School Funding Statistics[10] subtracted funding for the Pupil Premium and calculated changes in per pupil funding between 2010-11 and 2013-14. We then scaled the School Block in proportion to that change. In 2013-14 the school funding in cash terms minus the Pupil Premium was £35.9bn and in 2010-11 it was £35bn and in 2011-12 it was £35.1bn. We estimate the Schools’ Block per pupil in 2010-11 to be 97 per cent of its size in 2013-14 and for 2011-12 it was 98 per cent of 2013-14.
We have made our calculations for 19,068 schools with a full set of allocations data. This sample covers 94 per cent of schools and pupils.
We used this sample of schools to calculate changes in per pupil funding and schools’ costs to convert this into current prices.
We calculated the change in the spending power of mainstream schools by multiplying the change in real terms per pupil funding by the number of pupils in mainstream schools for school years Reception to Year 11. The total number of pupils was taken from the National Pupil Projections[11] and a Freedom of Information request[12].
| Year | State Mainstream Pupils From Reception to Yr11 | Core Funding Per Pupil | Change In Real-Terms Per Pupil Funding | Change In School Spending Power |
| (2025-26 prices) | (2025-26 prices) | (2025-26 prices) | ||
| 2010-11 | 6,535,532 | £7,462 | ||
| 2011-12 | 6,569,465 | £7,469 | £7 | £0.05bn |
| 2012-13 | 6,596,590 | £7,582 | £120 | £0.79bn |
| 2013-14 | 6,600,587 | £7,657 | £195 | £1.29bn |
| 2014-15 | 6,695,983 | £7,614 | £152 | £1.02bn |
| 2015-16 | 6,840,369 | £7,541 | £79 | £0.54bn |
| 2016-17 | 6,973,481 | £7,220 | -£241 | -£1.68bn |
| 2017-18 | 7,126,595 | £7,008 | -£453 | -£3.23bn |
| 2018-19 | 7,252,648 | £6,955 | -£506 | -£3.67bn |
| 2019-20 | 7,342,065 | £6,872 | -£590 | -£4.33bn |
| 2020-21 | 7,423,719 | £6,972 | -£490 | -£3.63bn |
| 2021-22 | 7,459,506 | £7,012 | -£450 | -£3.36bn |
| 2022-23 | 7,501,343 | £6,993 | -£469 | -£3.52bn |
| 2023-24 | 7,555,280 | £7,031 | -£431 | -£3.25bn |
| 2024-25 | 7,579,513 | £6,904 | -£558 | -£4.23bn |
Calculations
We calculated core school funding for the 19.068 mainstream schools (95% of mainstream schools) that had a full set of allocations data.


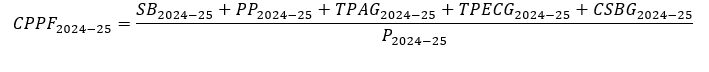
CPPF = Core Per Pupil Funding
SB = Schools’ Block Allocation (post-minimum funding guarantee)
ESG = Education Services Grant
PP = Pupil Premium
TPG = Teachers’ Pay Grant
TPECG = Teachers’ Pensions Employer Contributions Grant
SSG = Schools’ Supplementary Grant
MSAG = Mainstream Schools’ Additional Grant
TPAG = Teachers’ Pay Additional Grant
CSBG = Core Schools’ Budget Grant
We have used the same schools’ costs index as for mainstream schools.
Grant Funding for Special Schools and Maintained Nursery Schools
Funding for non-mainstream schools is completely set by the local authority and there are no national statistics for the current year. We have used school accounts data which is published for the previous year, so the latest data release is for 2023-24. We have taken the figure for Grant Funding, this is all the state money allocated to a school. The funding streams include:
- Funds Delegated By The Local Authority For Education of 2 to 15 year olds (I01)
- Funding For Sixth Form Students (I02)
- High Needs Top-Up Funding (I03)
- Funding For Minority Ethnic Pupils (I04)
- Pupil Premium (I05)
- Other Government Grants (I06)
- Other Grants And Payments Received (I07)
- Pupil-Focused Extended School Funding And / Or Grants (I15)
- Community-Focused School Funding And / Or Grants (I16)
- Income From The Coronavirus Job Retention Scheme (I18A)
- Income From Any Grants Provided In Relation To Coronavirus (Covid-19) (I18B)
- Income From Any Grants Provided In Relation To Coronavirus (Covid-19) Catch-Up Activity (I18C)
- Income From Other Additional Grants (I18D)
The full definitions are published here.
We calculated the change in real terms per pupil funding for non-mainstream schools by taking Grant Funding and converting it into real terms using schools’ costs.

CPPF = Change in real terms per pupil funding
GF = Grant Funding
P = Number of pupils
SC = Schools Costs Index

CSP = Change in spending power
Sources and Data Release
Schools Level Sources for Primary and Secondary Schools
- Pupil Premium 2011-12
- Pupil premium: funding for the 2012 to 2013 financial year
- Pupil premium 2013 to 2014 final allocation tables
- Pupil premium: 2014 to 2015 allocations and conditions of grant
- Pupil premium: funding allocations 2015 to 2016
- Pupil premium: allocations and conditions of grant 2016 to 2017
- Pupil premium: allocations and conditions of grant 2017 to 2018
- Pupil premium: allocations and conditions of grant 2018 to 2019
- Schools block funding allocations 2013 to 2014
- Schools block funding allocations 2014 to 2015
- Schools block funding allocations 2015 to 2016
- Schools block funding allocations 2016 to 2017
- Schools block funding allocations 2017 to 2018
- Schools block funding allocations 2018 to 2019
- School funding: between financial years 2010 to 2011 and 2020 to 2021
- School funding statistics: Financial year 2020-21
- School funding statistics: Financial year 2021-22
- School funding statistics: Financial year 2022-23
- School funding statistics: Financial year 2023-24
- Teachers’ pay grant: September 2018 to March 2019 allocations
Pupil Numbers for Primary and Secondary Schools
- Reception: National Pupil Projections
- Years 1 to 11: National pupil projections: Reporting year 2023
Funding and Pupil Numbers for Special Schools and Maintained Nursery Schools
LA Maintained Schools
- CFR 2022-23
- CFR 2021-22
- CFR 2020-21
- CFR 2019-20
- CFR 2018-19
- CFR 2017-18
- CFR 2016-17
- CFR 2015-16
- CFR 2014-15
- CFR special schools 2010-11 to 2013-14
- CFR nursery schools 2010-11 to 2013-14
Academies
- AAR 2022/23
- AAR 2021/22
- AAR 2020/21
- AAR 2019/20
- AAR 2018/19
- AAR 2017/18
- AAR 2016/17
- AAR 2015/16
- AAR 2014/15
- SFR 2013/14
- SFR 2012/13
- SFR 2011/12
The number of pupils in alternative provision (AP) in 2016-17 were clearly recorded inaccurately[13] and so we have excluded this year from our calculations for AP.
Data Release
All the data is available for download at www.bit.ly/school_cuts_data.
[1] Ibid, paragraph 48
[2] IFS, National Insurance contributions, March 2023
https://ifs.org.uk/taxlab/taxlab-data-item/ifs-fiscal-facts
[3] Ibid, paragraph 13
[4] Office for Budgetary Responsibility, March 2023 Economic and fiscal outlook – supplementary economy tables, Table 1.7
[5] DfE, Teacher strikes latest: Everything you need to know about the teacher pay offer, 28 March 2023
[6] Table 5
[7] DfE, Schools’ costs 2022 to 2024, February 2023, paragraph 16
https://assets.publishing.service.gov.uk/government/uploads/system/uploads/attachment_data/file/1137908/Schools__costs_2022_to_2024.pdf
[8] The full list is the calculations section.
[9] DfE, Dedicated schools grant 2013 to 2014, 1 July 2013, DSG table of allocations 2013 to 2014
https://www.gov.uk/government/publications/dedicated-schools-grant-2013-to-2014
[10] DfE, School funding statistics, 25 January 2024
https://explore-education-statistics.service.gov.uk/find-statistics/school-funding-statistics
[11] DfE, National pupil projections, 19 October 2023
https://explore-education-statistics.service.gov.uk/find-statistics/national-pupil-projections/2023
[12] What Do They Know, National Pupil Projections, 6 November 2023
https://www.whatdotheyknow.com/request/national_pupil_projections#incoming-2462009
[13] Pupil numbers in 2016-17 for AP were eight times higher than in 2015-16.
[14] DfE, Impact of the schools NFF, 28 November 2024
https://assets.publishing.service.gov.uk/media/674ed8cf34a339921747cfa3/NFF_schools_impact_table.ods
[15] The Pupil Premium represents just 6% of core school funding. So unless the change in funding is dramatically different to the 2.4% we have assumed there will be no difference to the overall figures.
[16] DfE, Schools’ Costs 2023 to 2025, February 2024
https://assets.publishing.service.gov.uk/media/65e0bd972f2b3b001c7cd7e1/Schools_costs_technical_note_2023_to_2025.pdf
